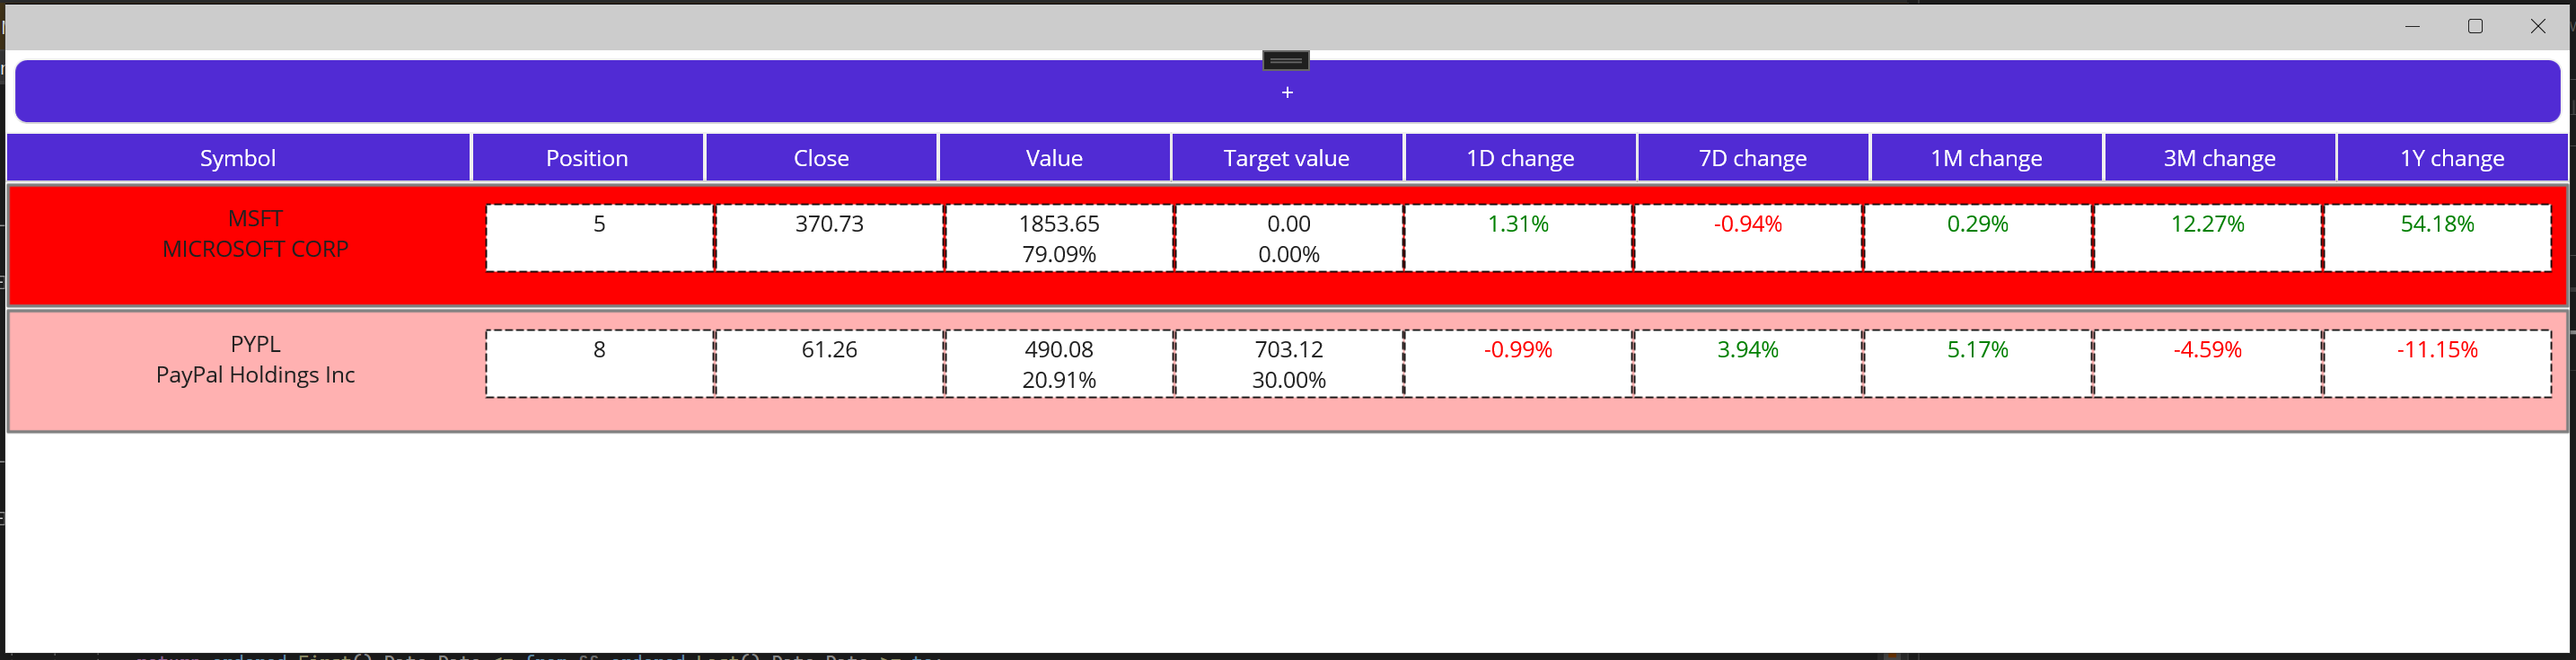
Navigating to stock details from the home page
The idea is to show a stock's details (value history on a chart, shares owned, target portfolio %, changes over the different periodicities) on a separate page. Integrating it in the main page would be difficult and lead to bad UX as there are already so many components.
On the main page each stock is represented by a grid (the DataTemplate of the CollectionView). Unlike buttons, grids don't have a Command property, nor tap or click events to trigger the navigation. However MAUI.NET has a feature called tap gesture recognizers that achieve the same thing.
<?xml version="1.0" encoding="utf-8" ?>
<ContentPage xmlns="http://schemas.microsoft.com/dotnet/2021/maui"
             xmlns:x="http://schemas.microsoft.com/winfx/2009/xaml"
             x:Class="IFiDemo.Presentation.Maui.MainPage"
             xmlns:views="clr-namespace:IFiDemo.Presentation.Maui">
    <Grid RowDefinitions="auto, auto, *">
        <!--other code omitted-->
        <CollectionView Grid.Row="2" ItemsSource="{Binding StockPositions}">
            <CollectionView.ItemTemplate>
                <DataTemplate>
                    <Border Stroke="Gray" StrokeThickness="2" BackgroundColor="{Binding BackgroundColor}" HeightRequest="80">
                        <Grid RowDefinitions="auto" ColumnDefinitions="2*,*,*,*,*,*,*,*,*,*" Padding="10">
                            <Grid.GestureRecognizers>
                                <TapGestureRecognizer Tapped="TapGestureRecognizer_Tapped" />
                            </Grid.GestureRecognizers>
                            <!--other code omitted-->
                        </Grid>
                    </Border>
                </DataTemplate>
            </CollectionView.ItemTemplate>
        </CollectionView>
    </Grid>
</ContentPage>public partial class MainPage : ContentPage
{
//other code omitted
private async void TapGestureRecognizer_Tapped(object sender, EventArgs e)
{
await Navigation.PushAsync(new StockDetails(_vm, (StockPosition)((BindableObject)sender).BindingContext));
}
}Creating the stock details page
Implementing general stock information
We can now create the page. We will start simple by including the general stock information and value changes for the different periodicities.
<?xml version="1.0" encoding="utf-8" ?>
<ContentPage xmlns="http://schemas.microsoft.com/dotnet/2021/maui"
             xmlns:x="http://schemas.microsoft.com/winfx/2009/xaml"
             x:Class="IFiDemo.Presentation.Maui.StockDetails"
             Title="Stock details">
    <VerticalStackLayout>
        <Grid ColumnDefinitions="*,*" RowDefinitions="*,*,*,*">
            <Label Grid.Column="0" Grid.Row="0" Margin="5" HorizontalTextAlignment="Center" Text="{Binding Stock.Symbol, StringFormat='{0}'}"/>
            <Label Grid.Column="0" Grid.Row="1" Margin="5" HorizontalTextAlignment="Center" Text="{Binding Ticker.Name}"/>
            <Label Grid.Column="0" Grid.Row="2" Margin="5" HorizontalTextAlignment="Center" Text="{Binding Stock.Close, StringFormat='close: {0:F2}'}"/>
            <Label Grid.Column="1" Grid.Row="0" Margin="5" HorizontalTextAlignment="Center" Text="{Binding StockPosition.Value, StringFormat='Value: {0:F2}'}"/>
            <Label Grid.Column="1" Grid.Row="1" Margin="5" HorizontalTextAlignment="Center" Text="{Binding StockPosition.CurrentHoldingPct, StringFormat='Value (%): {0:P2}'}"/>
            <Label Grid.Column="1" Grid.Row="2" Margin="5" HorizontalTextAlignment="Center" Text="{Binding StockPosition.TargetValue, StringFormat='Target value: {0:F2}'}"/>
        </Grid>
        <Grid ColumnDefinitions="*,*,*,*,*">
            <Label Grid.Column="0" FontSize="20" HorizontalTextAlignment="Center" Text="{Binding StockPosition.Change1Day, StringFormat='1D: {0:P2}'}" HeightRequest="30" />
            <Label Grid.Column="1" FontSize="20" HorizontalTextAlignment="Center" Text="{Binding StockPosition.Change7Days, StringFormat='7D: {0:P2}'}" HeightRequest="30" />
            <Label Grid.Column="2" FontSize="20" HorizontalTextAlignment="Center" Text="{Binding StockPosition.Change1Month, StringFormat='1M: {0:P2}'}" HeightRequest="30" />
            <Label Grid.Column="3" FontSize="20" HorizontalTextAlignment="Center" Text="{Binding StockPosition.Change3Months, StringFormat='3M: {0:P2}'}" HeightRequest="30" />
            <Label Grid.Column="4" FontSize="20" HorizontalTextAlignment="Center" Text="{Binding StockPosition.Change1Year, StringFormat='1Y: {0:P2}'}" HeightRequest="30" />
        </Grid>
    </VerticalStackLayout>
</ContentPage>using IFiDemo.Presentation.VM.Maui.ViewModels;
namespace IFiDemo.Presentation.Maui;
public partial class StockDetails : ContentPage
{
public StockDetails(MainVM mainVm, StockPosition stockPosition)
{
BindingContext = new StockDetailsVM(mainVm, stockPosition, Navigation.PopAsync);
InitializeComponent();
}
}As covered in the previous article, we can't do navigation in the view model as is, and we'll need access to the content page's navigation method. The reference to the main view model will be used later on.
using CommunityToolkit.Mvvm.ComponentModel;
using IFiDemo.Domain.ApiResponse;
namespace IFiDemo.Presentation.VM.Maui.ViewModels
{
public class StockDetailsVM : ObservableObject
{
public StockPosition StockPosition { get; }
public Stock Stock => StockPosition.Stock;
public Ticker Ticker => StockPosition.Ticker;
private readonly MainVM _mainVm;
public StockDetailsVM(MainVM mainVm, StockPosition stockPosition, Func<Task<Page>> navigateBack)
{
_mainVm = mainVm;
StockPosition = stockPosition;
}
}
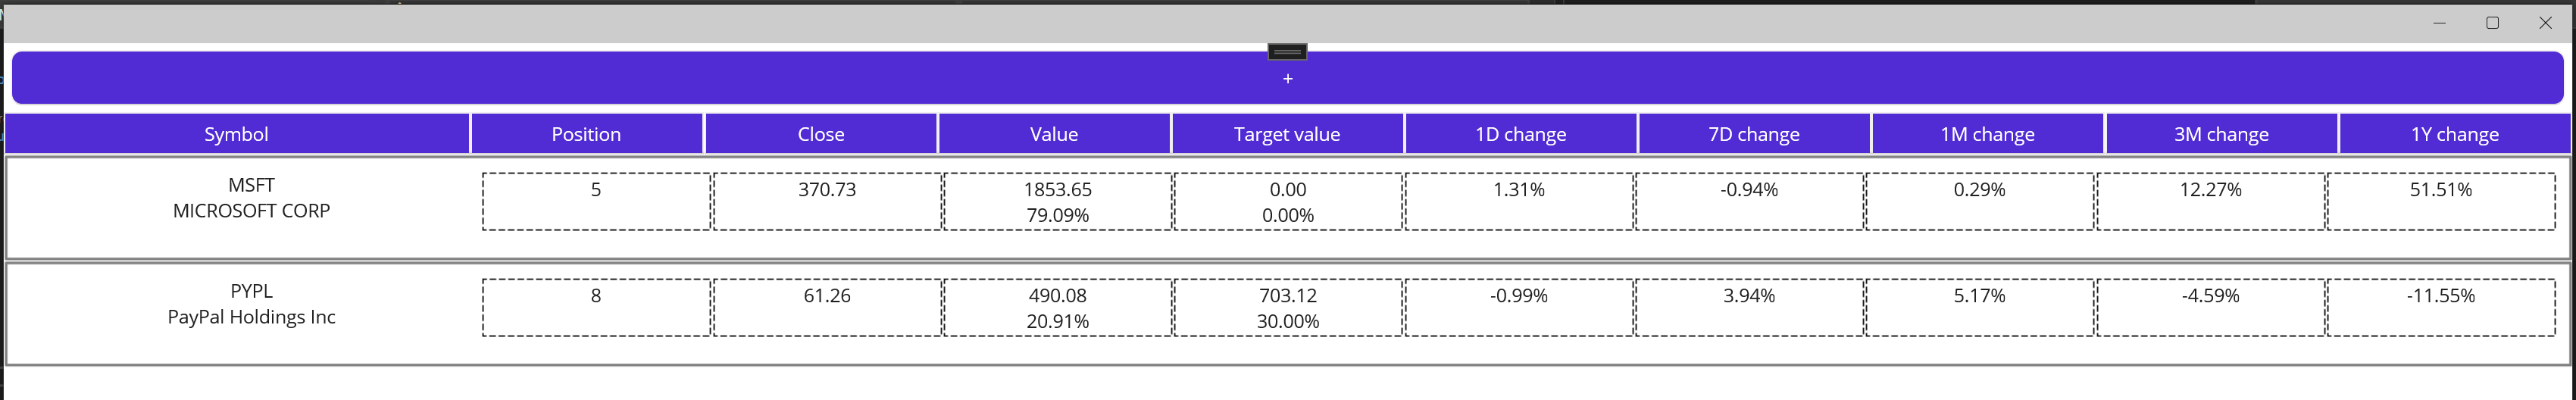
}When running the application we can now navigate from and to a stock's details and see the symbol, name, closing price, total value, total value in % relative to the portfolio and the price changes for the different periodicities.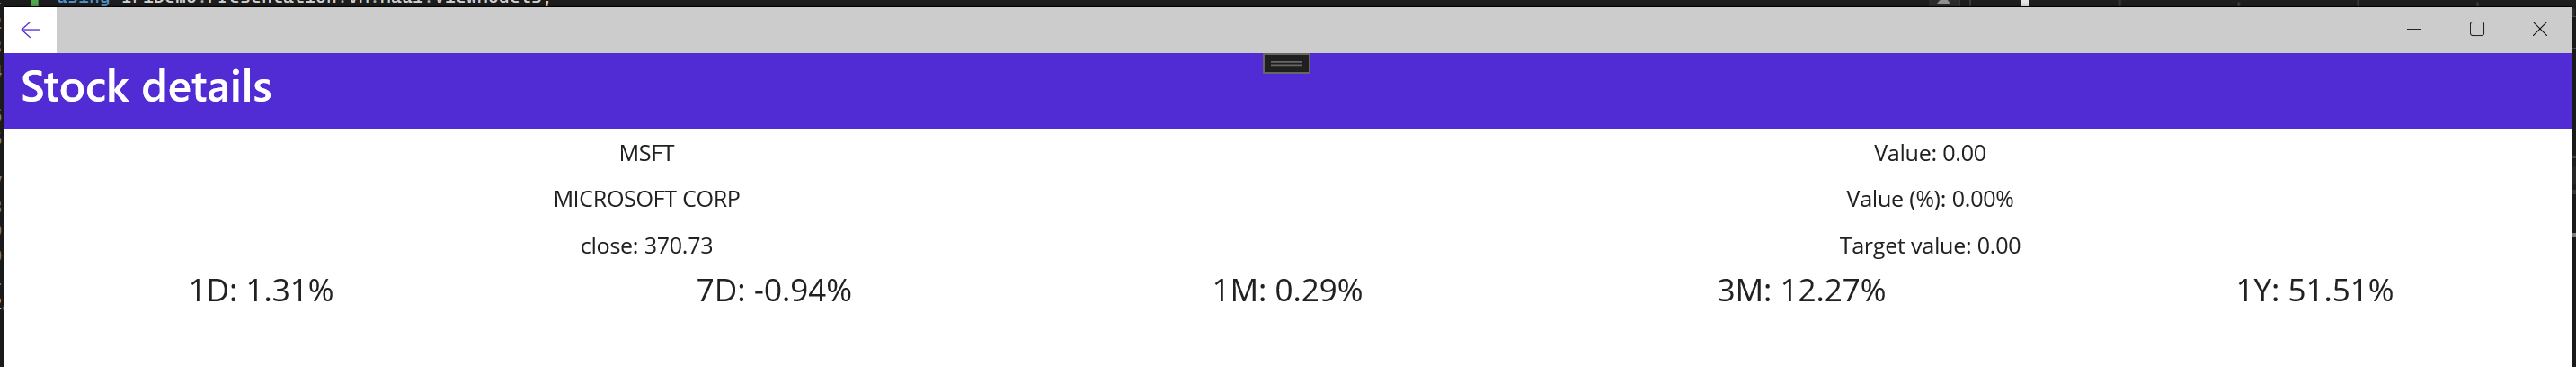
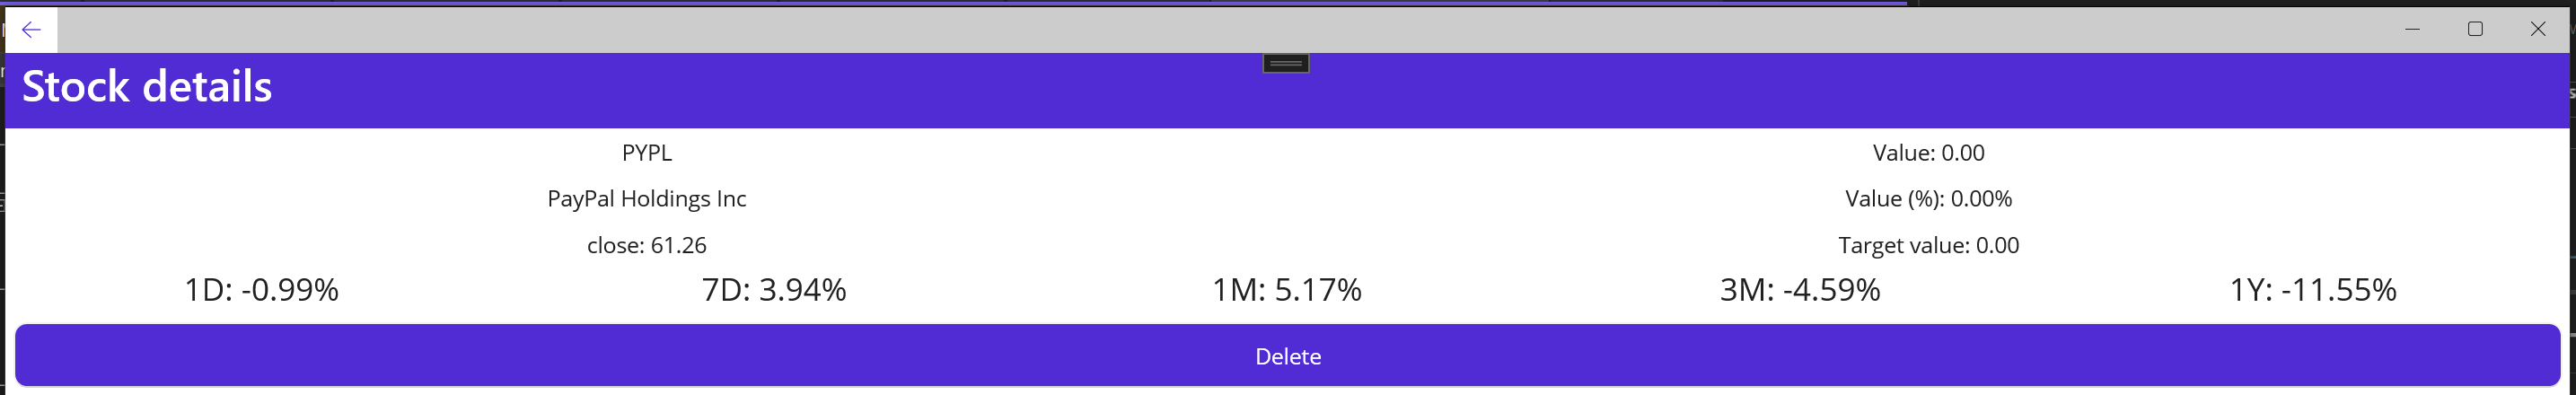
Implementing a delete button
So far we can search for stocks and add them to the list but there's no way to delete them. The details page is a good place to implement such a button. We are just binding to a DeleteStockCommand that directs the call to the main view model, which in its turn directs the call to the StockMarketDataFileService. This service removes the stock position from the collection, refreshes every other stock positions (because removing a stock position can impact the total portfolio value, and therefore a stock's position %) and saves them to a file again.
<?xml version="1.0" encoding="utf-8" ?>
<ContentPage xmlns="http://schemas.microsoft.com/dotnet/2021/maui"
             xmlns:x="http://schemas.microsoft.com/winfx/2009/xaml"
             x:Class="IFiDemo.Presentation.Maui.StockDetails"
             Title="Stock details">
    <VerticalStackLayout>
        <!--other code omitted-->
        <Button Margin="5" Text="Delete" Command="{Binding DeleteStockCommand}"/>
    </VerticalStackLayout>
</ContentPage>using CommunityToolkit.Mvvm.ComponentModel;
using IFiDemo.Domain.ApiResponse;
using System.Windows.Input;
namespace IFiDemo.Presentation.VM.Maui.ViewModels
{
public class StockDetailsVM : ObservableObject
{
public StockPosition StockPosition { get; }
public Stock Stock => StockPosition.Stock;
public Ticker Ticker => StockPosition.Ticker;
public ICommand DeleteStockCommand { get; }
private readonly MainVM _mainVm;
public StockDetailsVM(MainVM mainVm, StockPosition stockPosition, Func<Task<Page>> navigateBack)
{
_mainVm = mainVm;
StockPosition = stockPosition;
DeleteStockCommand = new Command(
async () =>
{
await mainVm.DeleteStockPositionAsync(StockPosition);
await navigateBack();
});
}
}
}public partial class MainVM : ObservableObject
{
//other code omitted
internal Task DeleteStockPositionAsync(StockPosition stockPosition) => _fileService.DeleteStockPositionAsync(stockPosition);
}public class StockMarketDataFileService
{
//other code omitted
internal async Task DeleteStockPositionAsync(StockPosition stockPosition)
{
_stockPositions.Remove(stockPosition);
foreach (var _stockPosition in _stockPositions)
_stockPosition.Refresh(_stockPositions);
await SaveStockPositionsAsync(_stockPositions);
}
}We can now remove a stock from the list ☺
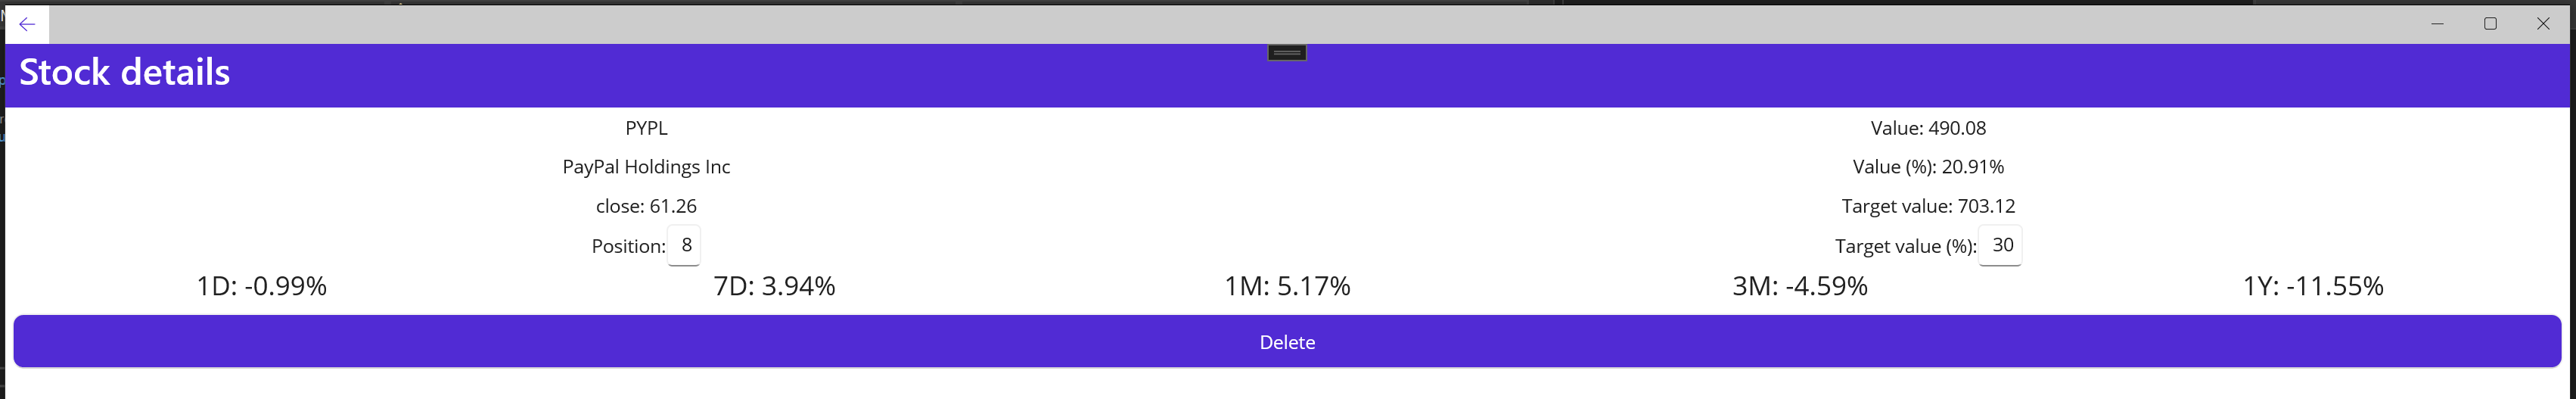
Changing a stock's position and target value (%)
We have implemented a stock position and target value (relative to the entire portoflio) from the very start. However there was never a way to change these values. The stock details page might also be a good place to do this.
<?xml version="1.0" encoding="utf-8" ?>
<ContentPage xmlns="http://schemas.microsoft.com/dotnet/2021/maui"
             xmlns:x="http://schemas.microsoft.com/winfx/2009/xaml"
             x:Class="IFiDemo.Presentation.Maui.StockDetails"
             Title="Stock details">
    <VerticalStackLayout>
        <Grid ColumnDefinitions="*,*" RowDefinitions="*,*,*,*">
            <Label Grid.Column="0" Grid.Row="0" Margin="5" HorizontalTextAlignment="Center" Text="{Binding Stock.Symbol, StringFormat='{0}'}"/>
            <Label Grid.Column="0" Grid.Row="1" Margin="5" HorizontalTextAlignment="Center" Text="{Binding Ticker.Name}"/>
            <Label Grid.Column="0" Grid.Row="2" Margin="5" HorizontalTextAlignment="Center" Text="{Binding Stock.Close, StringFormat='close: {0:F2}'}"/>
            <HorizontalStackLayout Grid.Column="0" Grid.Row="3" HorizontalOptions="Center">
                <Label Text="Position: " VerticalTextAlignment="Center"/>
                <Entry Text="{Binding Position, Mode=TwoWay}" HorizontalTextAlignment="Center" MinimumWidthRequest="20" />
            </HorizontalStackLayout>
            <Label Grid.Column="1" Grid.Row="0" Margin="5" HorizontalTextAlignment="Center" Text="{Binding StockPosition.Value, StringFormat='Value: {0:F2}'}"/>
            <Label Grid.Column="1" Grid.Row="1" Margin="5" HorizontalTextAlignment="Center" Text="{Binding StockPosition.CurrentHoldingPct, StringFormat='Value (%): {0:P2}'}"/>
            <Label Grid.Column="1" Grid.Row="2" Margin="5" HorizontalTextAlignment="Center" Text="{Binding StockPosition.TargetValue, StringFormat='Target value: {0:F2}'}"/>
            <HorizontalStackLayout Grid.Column="1" Grid.Row="3" HorizontalOptions="Center">
                <Label Text="Target value (%): " VerticalTextAlignment="Center"/>
                <Entry Text="{Binding TargetHoldingPct, Mode=TwoWay}" HorizontalTextAlignment="Center" MinimumWidthRequest="20" />
            </HorizontalStackLayout>
        </Grid>
        <Button Margin="5" Text="Delete" Command="{Binding DeleteStockCommand}"/>
    </VerticalStackLayout>
</ContentPage>
From the backend there a few things to pay attention to. Just like removing a stock, changing a stock's position impacts the total value of the portfolio and therefore also the value (%) and the target value (absolute value) of every other stock. This means that we have to recalculate the value and target value of every other stock with the existing Refresh method. When doing this, the value and target value of the currently opened stock will also be recalculated real time.
public class StockDetailsVM : ObservableObject
{
    //other code omitted
    public int Position
    {
        get => StockPosition.Position;
        set
        {
            StockPosition.Position = value;
            RefreshStockPositions();
            _mainVm.Save();
        }
    }
    public float TargetHoldingPct
    {
        get => StockPosition.TargetHoldingPct * 100;
        set
        {
            StockPosition.TargetHoldingPct = value / 100f;
            RefreshStockPositions();
            _mainVm.Save();
        }
    }

    private void RefreshStockPositions()
    {
        foreach (var stockPosition in _mainVm.StockPositions)
        {
            stockPosition.Refresh(_mainVm.StockPositions);
        }
    }
}
Saving can take longer than the time between two position or target % changes. Because saving the file happens asynchronously and doesn't block the UI we need to ensure that only the last modification gets saved to disk. For this reason saving is done from the main view model to synchronize concurrent save requests.
private SemaphoreSlim _fileLocker = new(1, 1);
public async Task Save()
{
    await _fileLocker.WaitAsync();
    try
    {
        await _fileService.SaveStockPositionsAsync(StockPositions.ToList());
    }
    finally
    {
        _fileLocker.Release();
    }
}
From the start we did not think of the possibility that a stock's position can change and this can impact a stock position's value. So setting a stock position's Position property doesn't actually impact Value unless we recalculate it (by notifying the UI of a Value change with OnPropertyChanged). Note that we are using the view model's PropertyChanged event to do the recalculation. We might just as well call OnPropertyChanged(nameof(Value)) from the Position property, however this is personal preference and we have to strike a balance between concise code, ease of use and following a design pattern to the letter. The Position property is automatically generated from the private _position field and cannot be changed in its current form.
//using namespaces...

namespace IFiDemo.Presentation.VM.Maui.ViewModels
{
    public partial class StockPosition : ObservableObject
    {
        //other code omitted
        public StockPosition() //for json deserialization
        {
            PropertyChanged += StockPosition_PropertyChanged;
        }
        public StockPosition(Stock stock, Ticker ticker)
        {
            Stock = stock;
            Ticker = ticker;
            Position = 0;
            TargetHoldingPct = 0;
            PropertyChanged += StockPosition_PropertyChanged;
        }

        private void StockPosition_PropertyChanged(object sender, System.ComponentModel.PropertyChangedEventArgs e)
        {
            if (e.PropertyName == nameof(Position))
            {
                OnPropertyChanged(nameof(Value));
            }
        }
    }
}
When running the application there will now be two text fields that allow us to modify the amount of stock shares owned and the desired % that this stock should take up relative to the entire portfolio.
Implementing a candlestick chart
The last part of the details page is the most exciting one in my opinion: a chart. Out of the box MAUI.NET doesn't support charts but there are lots of great libraries that can do this. After an extensive comparison I chose LiveCharts2 (MIT license). This is not only supported in MAUI.NET but also in lots of other UI frameworks (Xamarin, Blazor, WPF etc.)! All documentation can be found on the website with examples that are easy to follow. There's even a candlestick chart demo. We will do things slightly differently but it's good enough to get started.
Here is the package to install: https://www.nuget.org/packages/LiveChartsCore.SkiaSharpView.Maui/2.0.0-beta.710
Before we can start we have to configure LiveCharts in the App class. This is a requirement according to the documentation.
We will also use the light theme in our application.
using IFiDemo.Domain.ApiResponse;
using LiveChartsCore;
using LiveChartsCore.SkiaSharpView;

namespace IFiDemo.Presentation.Maui
{
    public partial class App : Application
    {
        public App()
        {
            InitializeComponent();

            MainPage = new AppShell();
            LiveCharts.Configure(config =>
            config
                .AddSkiaSharp()
                .AddDefaultMappers()
                .AddLightTheme()
            );
        }
    }
}
The SkiaSharp services have to be registered during application startup (MauiProgram.cs) in order to use them.
public static class MauiProgram
{
    public static MauiApp CreateMauiApp()
    {
        var builder = MauiApp.CreateBuilder();
        builder
            .UseSkiaSharp(true)
            .UseMauiApp<App>()
            .UseMauiCommunityToolkit()
            .ConfigureFonts(fonts =>
            {
                fonts.AddFont("OpenSans-Regular.ttf", "OpenSansRegular");
                fonts.AddFont("OpenSans-Semibold.ttf", "OpenSansSemibold");
            });

        return builder.Build();
    }
}
We are using a CartesianChart control to render the candlestick chart. This control can render any chart that can be plotted on a Cartesian coordinate system. It has lot of properties that allow us to customize the chart however we want. In our app we will customize the Series and X axes.
<?xml version="1.0" encoding="utf-8" ?>
<ContentPage xmlns="http://schemas.microsoft.com/dotnet/2021/maui"
             xmlns:x="http://schemas.microsoft.com/winfx/2009/xaml"
             x:Class="IFiDemo.Presentation.Maui.StockDetails"
             xmlns:lvc="clr-namespace:LiveChartsCore.SkiaSharpView.Maui;assembly=LiveChartsCore.SkiaSharpView.Maui"
             Title="Stock details">
    <VerticalStackLayout>
        <!--other code omitted-->
        <Grid HeightRequest="400" IsVisible="{Binding ChartVisible}">
            <lvc:CartesianChart
            Series="{Binding Series}" XAxes="{Binding XAxes}">
            </lvc:CartesianChart>
        </Grid>
    </VerticalStackLayout>
</ContentPage>
The Series property is an array of data series, so multiple series can be plotted at once on the same chart. We can use any data type for the input, as long as we tell LiveCharts how this type should be mapped to a primary, secondary, tertiary... value. This mapping can be set in the App class.
These values are then used to correctly render each data point. The documentation is a massive help here to figure out what these values mean.
A TooltipLabelFormatter is not required, however if not set it will just use the default one for the used ISeries type (CandlesticksSeries in our case), which is usually not want you want.
using CommunityToolkit.Mvvm.ComponentModel;
using IFiDemo.Domain.ApiResponse;
using LiveChartsCore;
using LiveChartsCore.SkiaSharpView;
using System.Windows.Input;

namespace IFiDemo.Presentation.VM.Maui.ViewModels
{
    public class StockDetailsVM : ObservableObject
    {
        public Ticker Ticker => StockPosition.Ticker;
        public ISeries[] Series { get; }
        public Axis[] XAxes { get; }
        public bool ChartVisible => StockPosition.HistoricalData.Length >= 2;

        public StockDetailsVM(MainVM mainVm, StockPosition stockPosition, Func<Task<Page>> navigateBack)
        {
            //other code omitted
            Series = new ISeries[]
            {
                new CandlesticksSeries<Stock>
                {
                    Values = StockPosition.HistoricalData,
                    TooltipLabelFormatter = (p) => $"H: {p.PrimaryValue:N2}, O: {p.TertiaryValue:N2}, C: {p.QuaternaryValue:N2}, L: {p.QuinaryValue:N2}\r\n{p.Model.Date.ToString("dd/MM/yyyy")}",
                }
            };
            XAxes = new Axis[]
            {
                new Axis
                {
                    UnitWidth = TimeSpan.FromDays(1).Ticks,
                    LabelsRotation = 20,
                    Labeler = p => new DateTime((long)p).ToString("dd/MM/yyyy"),
                }
            };
        }
        //other code omitted
    }
}public App()
{
InitializeComponent();
MainPage = new AppShell();
LiveCharts.Configure(config =>
config
.AddSkiaSharp()
.AddDefaultMappers()
.AddLightTheme()
.HasMap<Stock>((stock, point) =>
{
point.PrimaryValue = (double)stock.High;
point.SecondaryValue = stock.Date.Ticks;
point.TertiaryValue = (double)stock.Open;
point.QuaternaryValue = (double)stock.Close;
point.QuinaryValue = (double)stock.Low;
})
);
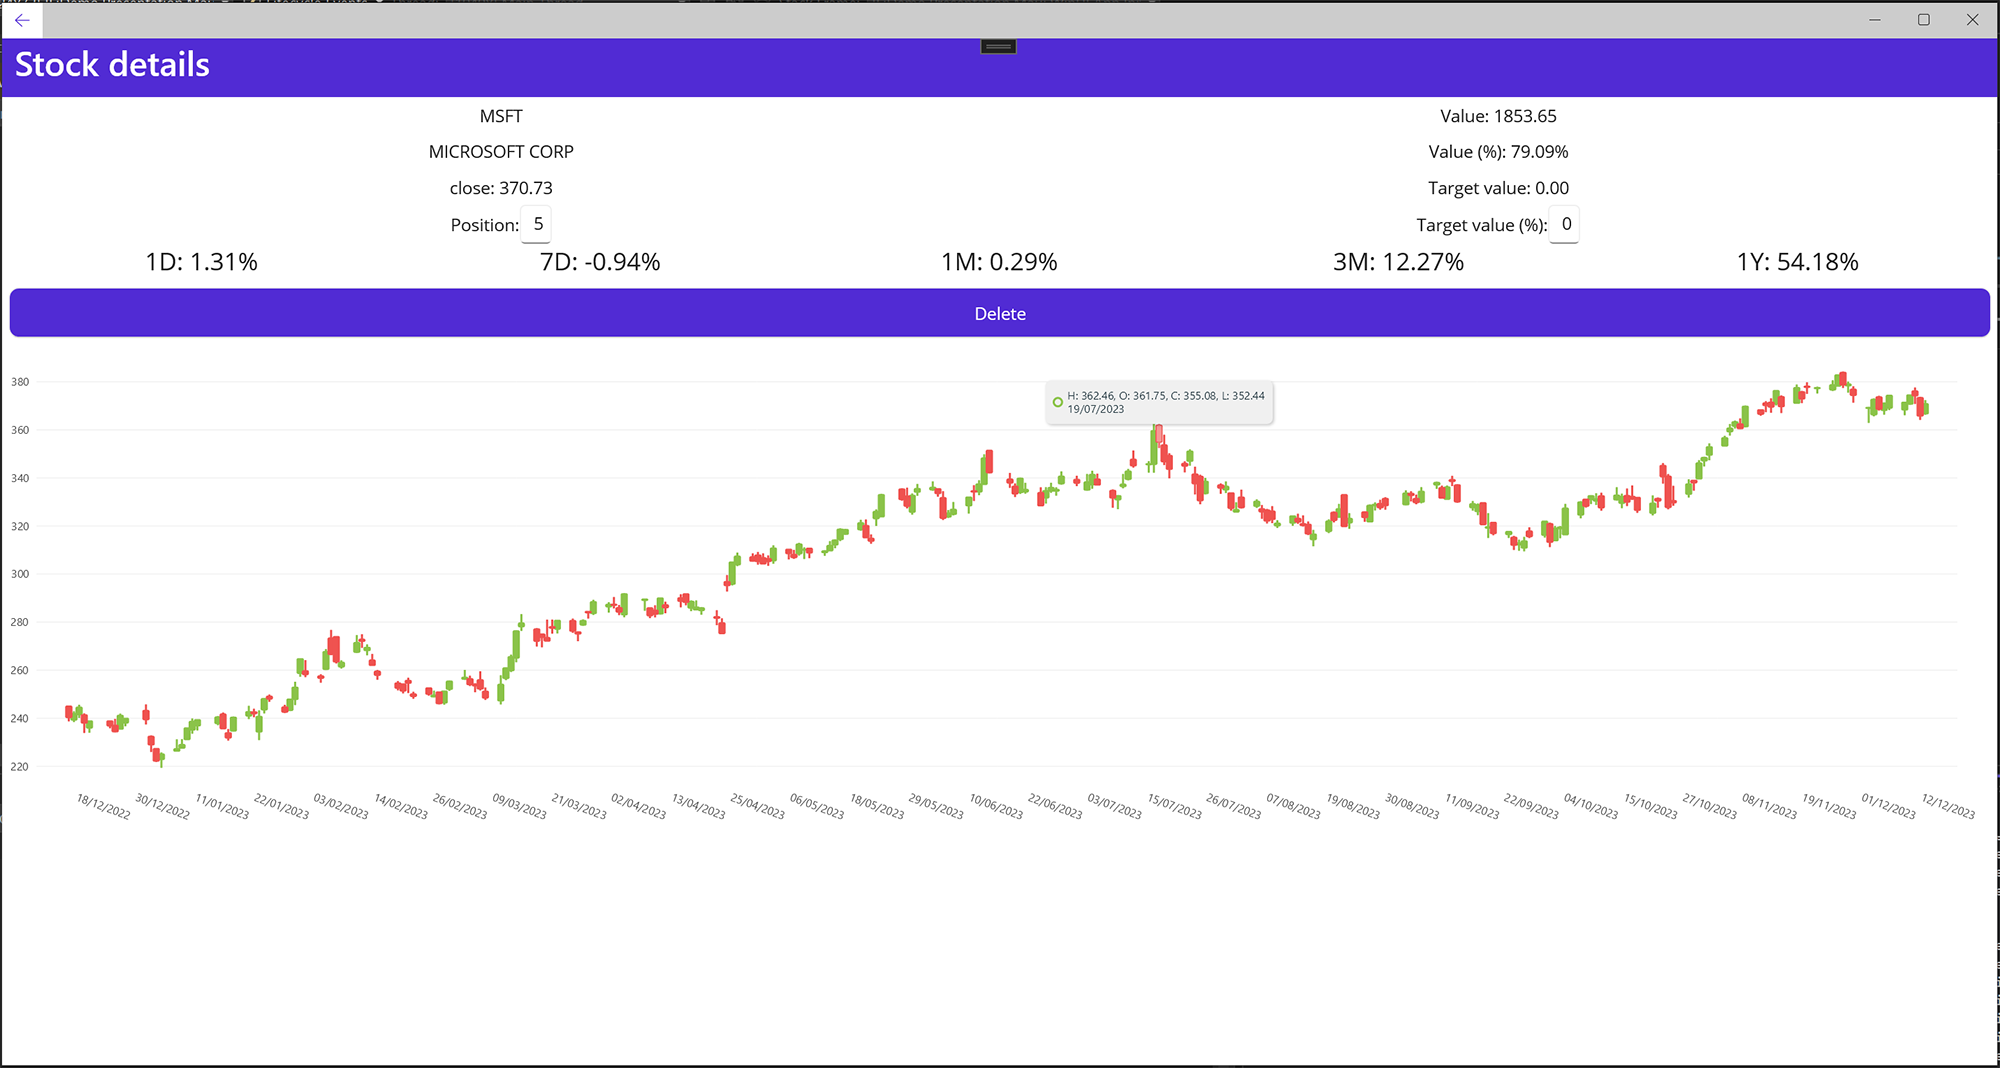
}When running the application we can now open any stock and see its price history for the past year on a chart.
Adding color
Highlighting price changes
I believe the app would be more elegant and user friendly if price changes were highlighted in red or green (as we are used to from the finance world); red for negative changes, green for positive changes and black for 0. This can be achieved with triggers in XAML. No changes in the view model are required.
Data triggers let you compare a binding with a value. If it matches the style will be set. However we have to do a less than/greater than comparison so we'll need a converter that converts the binding to true or false. Notice that cases whereby two values are exactly equal will not be covered by either of these converters (0% price change = black).
using System.Globalization;

namespace IFiDemo.Utilities.Maui.ValueConverters
{
    public class LessThanConverter : IValueConverter
    {
        public object Convert(object value, Type targetType, object parameter, CultureInfo culture)
        {
            return ((float)value) < Cutoff;
        }

        public object ConvertBack(object value, Type targetType, object parameter, CultureInfo culture)
        {
            throw new NotImplementedException();
        }

        public float Cutoff { get; set; } = 0;
    }
}using System.Globalization;
namespace IFiDemo.Utilities.Maui.ValueConverters
{
public class GreaterThanConverter : IValueConverter
{
public object Convert(object value, Type targetType, object parameter, CultureInfo culture)
{
return ((float)value) > Cutoff;
}
public object ConvertBack(object value, Type targetType, object parameter, CultureInfo culture)
{
throw new NotImplementedException();
}
public float Cutoff { get; set; } = 0;
}
}Just like the IsNullConverter these converters have to be registered somewhere in order to them as a static resource.
<?xml version="1.0" encoding="utf-8" ?>
<ResourceDictionary xmlns="http://schemas.microsoft.com/dotnet/2021/maui"
             xmlns:x="http://schemas.microsoft.com/winfx/2009/xaml"
             xmlns:converters="clr-namespace:IFiDemo.Utilities.Maui.ValueConverters;assembly=IFiDemo.Utilities.Maui"
             xmlns:toolkit="http://schemas.microsoft.com/dotnet/2022/maui/toolkit"
             x:Class="IFiDemo.Presentation.Maui.Resources.Converters.Converters">
    <converters:LessThanConverter x:Key="lessThanConverter" />
    <converters:GreaterThanConverter x:Key="greaterThanConverter" />
    <toolkit:IsNullConverter x:Key="isNullConverter" />
</ResourceDictionary>
Using these converters, we can now implement the data triggers in all price change columns on the main page.
<?xml version="1.0" encoding="utf-8" ?>
<ContentPage xmlns="http://schemas.microsoft.com/dotnet/2021/maui"
             xmlns:x="http://schemas.microsoft.com/winfx/2009/xaml"
             x:Class="IFiDemo.Presentation.Maui.MainPage"
             xmlns:views="clr-namespace:IFiDemo.Presentation.Maui">
    <Grid RowDefinitions="auto, auto, *">
        <!--other code omitted-->
        <CollectionView Grid.Row="2" ItemsSource="{Binding StockPositions}">
            <CollectionView.ItemTemplate>
                <DataTemplate>
                    <Border Stroke="Gray" StrokeThickness="2" BackgroundColor="{Binding BackgroundColor}" HeightRequest="80">
                        <Grid RowDefinitions="auto" ColumnDefinitions="2*,*,*,*,*,*,*,*,*,*" Padding="10">
                            <Border Grid.Column="5">
                                <Label  HorizontalOptions="Center" Text="{Binding Change1Day, StringFormat='{0:P2}'}">
                                    <Label.Triggers>
                                        <DataTrigger TargetType="Label" Binding="{Binding Change1Day, Converter={StaticResource lessThanConverter}}" Value="True">
                                            <Setter Property="TextColor"  Value="Red" />
                                        </DataTrigger>
                                        <DataTrigger TargetType="Label" Binding="{Binding Change1Day, Converter={StaticResource greaterThanConverter}}" Value="True">
                                            <Setter Property="TextColor"  Value="Green" />
                                        </DataTrigger>
                                    </Label.Triggers>
                                </Label>
                            </Border>
                            <Border Grid.Column="6">
                                <Label HorizontalOptions="Center" Text="{Binding Change7Days, StringFormat='{0:P2}'}">
                                    <Label.Triggers>
                                        <DataTrigger TargetType="Label" Binding="{Binding Change7Days, Converter={StaticResource lessThanConverter}}" Value="True">
                                            <Setter Property="TextColor"  Value="Red" />
                                        </DataTrigger>
                                        <DataTrigger TargetType="Label" Binding="{Binding Change7Days, Converter={StaticResource greaterThanConverter}}" Value="True">
                                            <Setter Property="TextColor"  Value="Green" />
                                        </DataTrigger>
                                    </Label.Triggers>
                                </Label>
                            </Border>
                            <!--other code omitted for brevity-->
                        </Grid>
                    </Border>
                </DataTemplate>
            </CollectionView.ItemTemplate>
        </CollectionView>
    </Grid>
</ContentPage>
The same thing can be done on the stock details page.
<?xml version="1.0" encoding="utf-8" ?>
<ContentPage xmlns="http://schemas.microsoft.com/dotnet/2021/maui"
xmlns:x="http://schemas.microsoft.com/winfx/2009/xaml"
x:Class="IFiDemo.Presentation.Maui.StockDetails"
xmlns:lvc="clr-namespace:LiveChartsCore.SkiaSharpView.Maui;assembly=LiveChartsCore.SkiaSharpView.Maui"
Title="Stock details">
<VerticalStackLayout>
<Grid ColumnDefinitions="*,*,*,*,*">
<Label Grid.Column="0" FontSize="20" HorizontalTextAlignment="Center" Text="{Binding StockPosition.Change1Day, StringFormat='1D: {0:P2}'}" HeightRequest="30">
<Label.Triggers>
<DataTrigger TargetType="Label" Binding="{Binding StockPosition.Change1Day, Converter={StaticResource lessThanConverter}}" Value="True">
<Setter Property="TextColor" Value="Red" />
</DataTrigger>
<DataTrigger TargetType="Label" Binding="{Binding StockPosition.Change1Day, Converter={StaticResource greaterThanConverter}}" Value="True">
<Setter Property="TextColor" Value="Green" />
</DataTrigger>
</Label.Triggers>
</Label>
<Label Grid.Column="1" FontSize="20" HorizontalTextAlignment="Center" Text="{Binding StockPosition.Change7Days, StringFormat='7D: {0:P2}'}" HeightRequest="30">
<Label.Triggers>
<DataTrigger TargetType="Label" Binding="{Binding StockPosition.Change7Days, Converter={StaticResource lessThanConverter}}" Value="True">
<Setter Property="TextColor" Value="Red" />
</DataTrigger>
<DataTrigger TargetType="Label" Binding="{Binding StockPosition.Change7Days, Converter={StaticResource greaterThanConverter}}" Value="True">
<Setter Property="TextColor" Value="Green" />
</DataTrigger>
</Label.Triggers>
</Label>
<!--other code omitted for brevity-->
</Grid>
<!--other code omitted-->
</VerticalStackLayout>
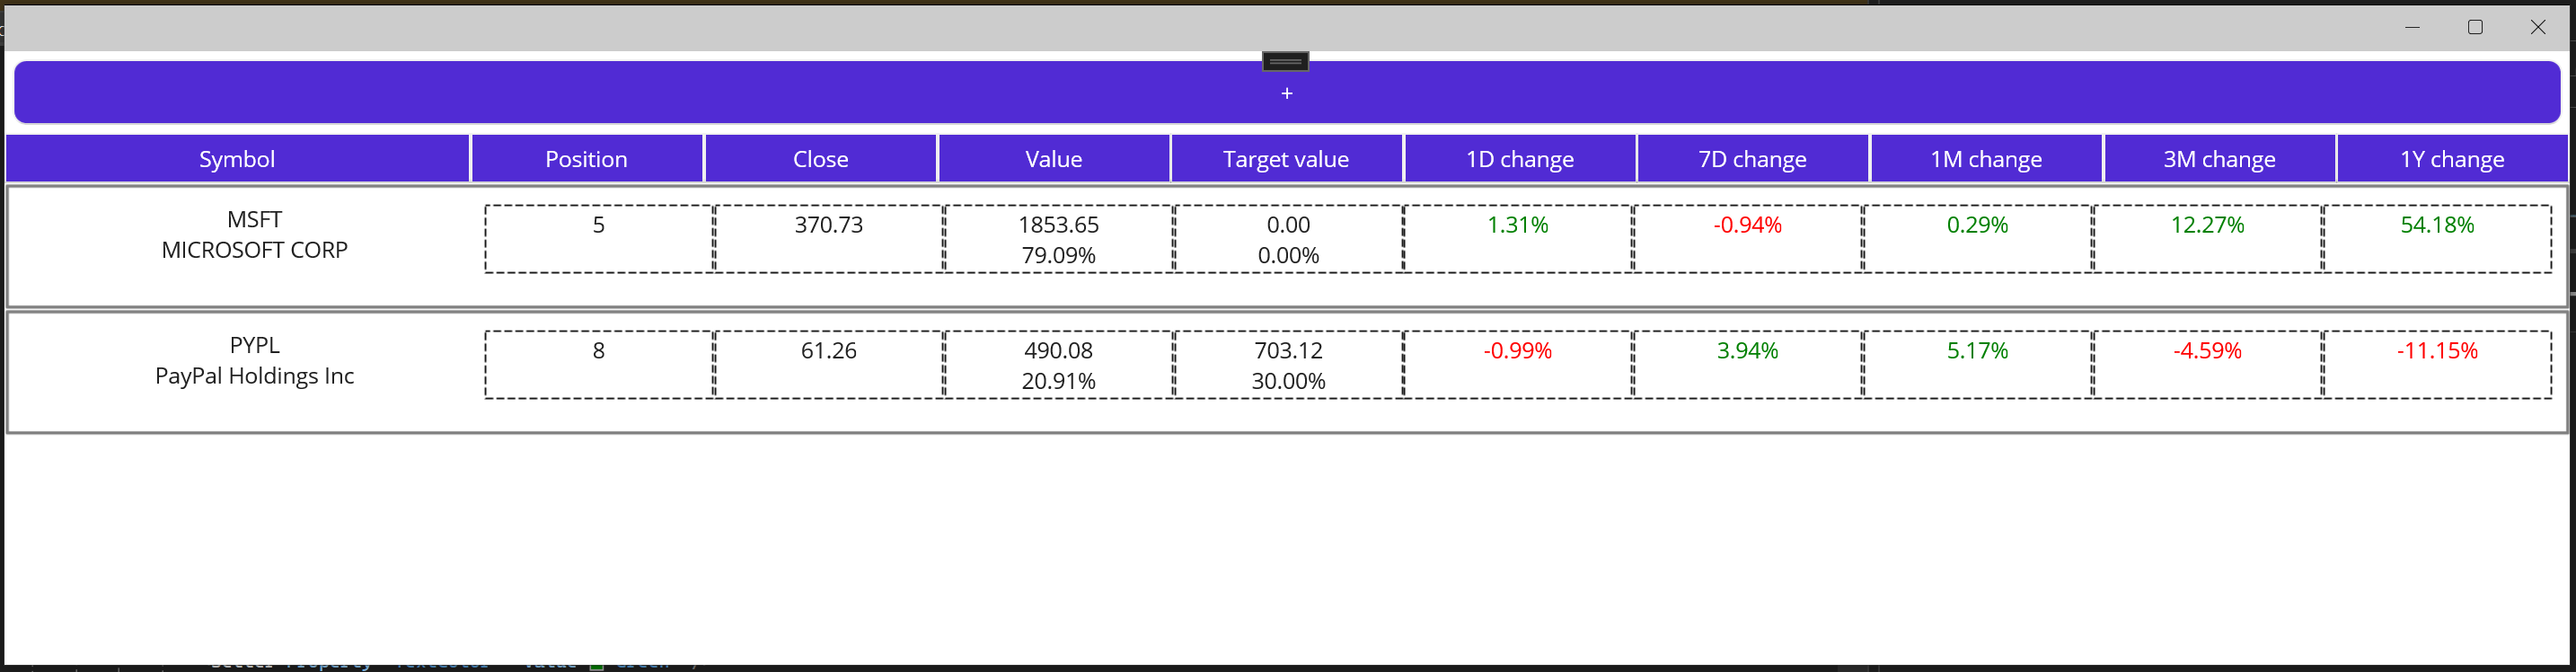
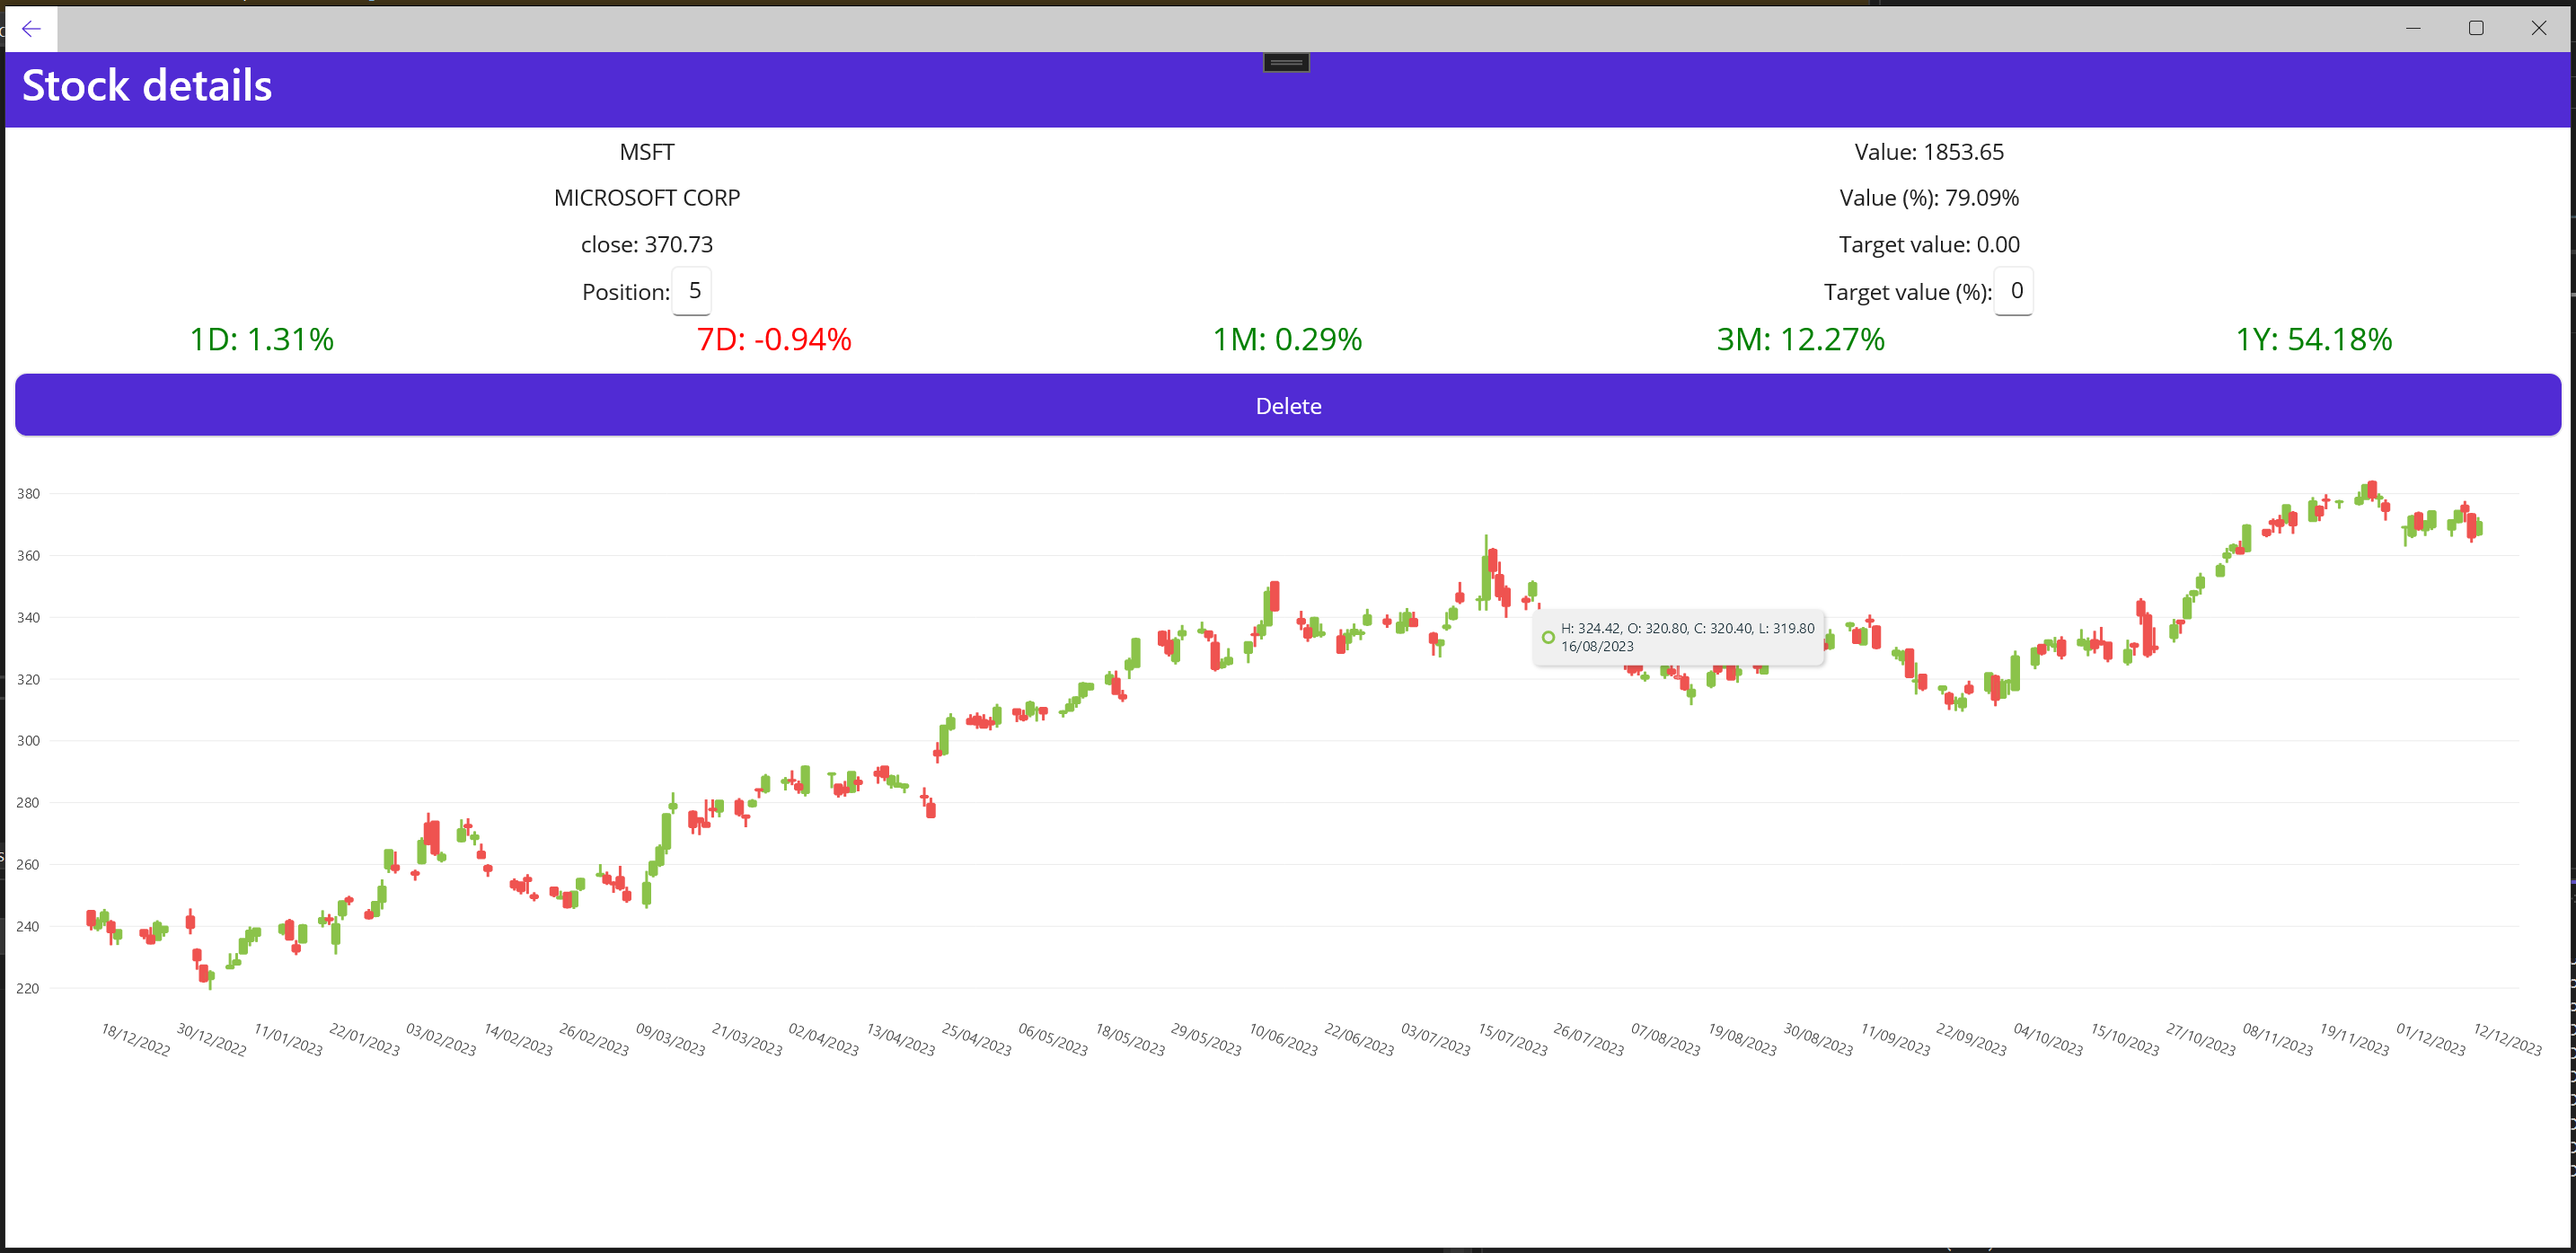
</ContentPage>When running the application we can now see that all price changes have a color.
Highlighting stock by value vs. target value
To end this article there's one last thing I would like to do. If you are a risk averse investor like me you pay attention to the % of your total portfolio value a certain stock or fund takes up. You would like each stock to stay around a certain percentage. This is the entire reason why we implemented this value earlier. However, as the list of owned stocks grows it becomes harder to keep track of this. We would like to see the stocks that require "attention" at a glance (in either direction; too high or too low), so we will highlight these in a color.
In the main page we can just bind to a color.
<CollectionView Grid.Row="2" ItemsSource="{Binding StockPositions}">
    <CollectionView.ItemTemplate>
        <DataTemplate>
            <Border Stroke="Gray" StrokeThickness="2" BackgroundColor="{Binding BackgroundColor}" HeightRequest="80">
In the view model we can implement this color by setting the green and blue values (in the rgb value) to the difference between current % and target %, relative to target %.
public partial class StockPosition : ObservableObject
{
    public Color BackgroundColor => GetBackgroundColor();

    internal void Refresh(IEnumerable<StockPosition> stockPositions)
    {
        if (stockPositions.Sum(x => x.Value) > 0)
        {
            CurrentHoldingPct = (float)(Value / stockPositions.Sum(x => x.Value));
            TargetValue = (decimal)TargetHoldingPct * stockPositions.Sum(x => x.Value);
            OnPropertyChanged(nameof(BackgroundColor));
        }
    }

    private Color GetBackgroundColor()
    {
        float currentOnTargetHoldingRatio = CurrentHoldingPct - TargetHoldingPct;
        byte r = 255;
        byte g, b;

        g = b = (byte)((1f - (Math.Abs(currentOnTargetHoldingRatio) / TargetHoldingPct)) * 255f);

        return Color.FromRgb(r, g, b);
    }
    //other code omitted
}
When running the app we can see that stocks that require attention (due to a too high or too low value) are highlighted in red.